
Contour Map
Contour lines turn a flat sheet of paper into a landscape: every line joins points of equal height, and their spacing and shape reveal hills, valleys, ridges and cliffs. This contour map maker generates terrain you can shape yourself, draws the contours at the interval you choose and lets you cut a topographic profile between any two points — ideal for geography lessons, hikers learning to read maps, or game maps.
- Free to use
- No sign-up
- Runs in your browser
Contour map maker
Contour Map Worksheet Pack
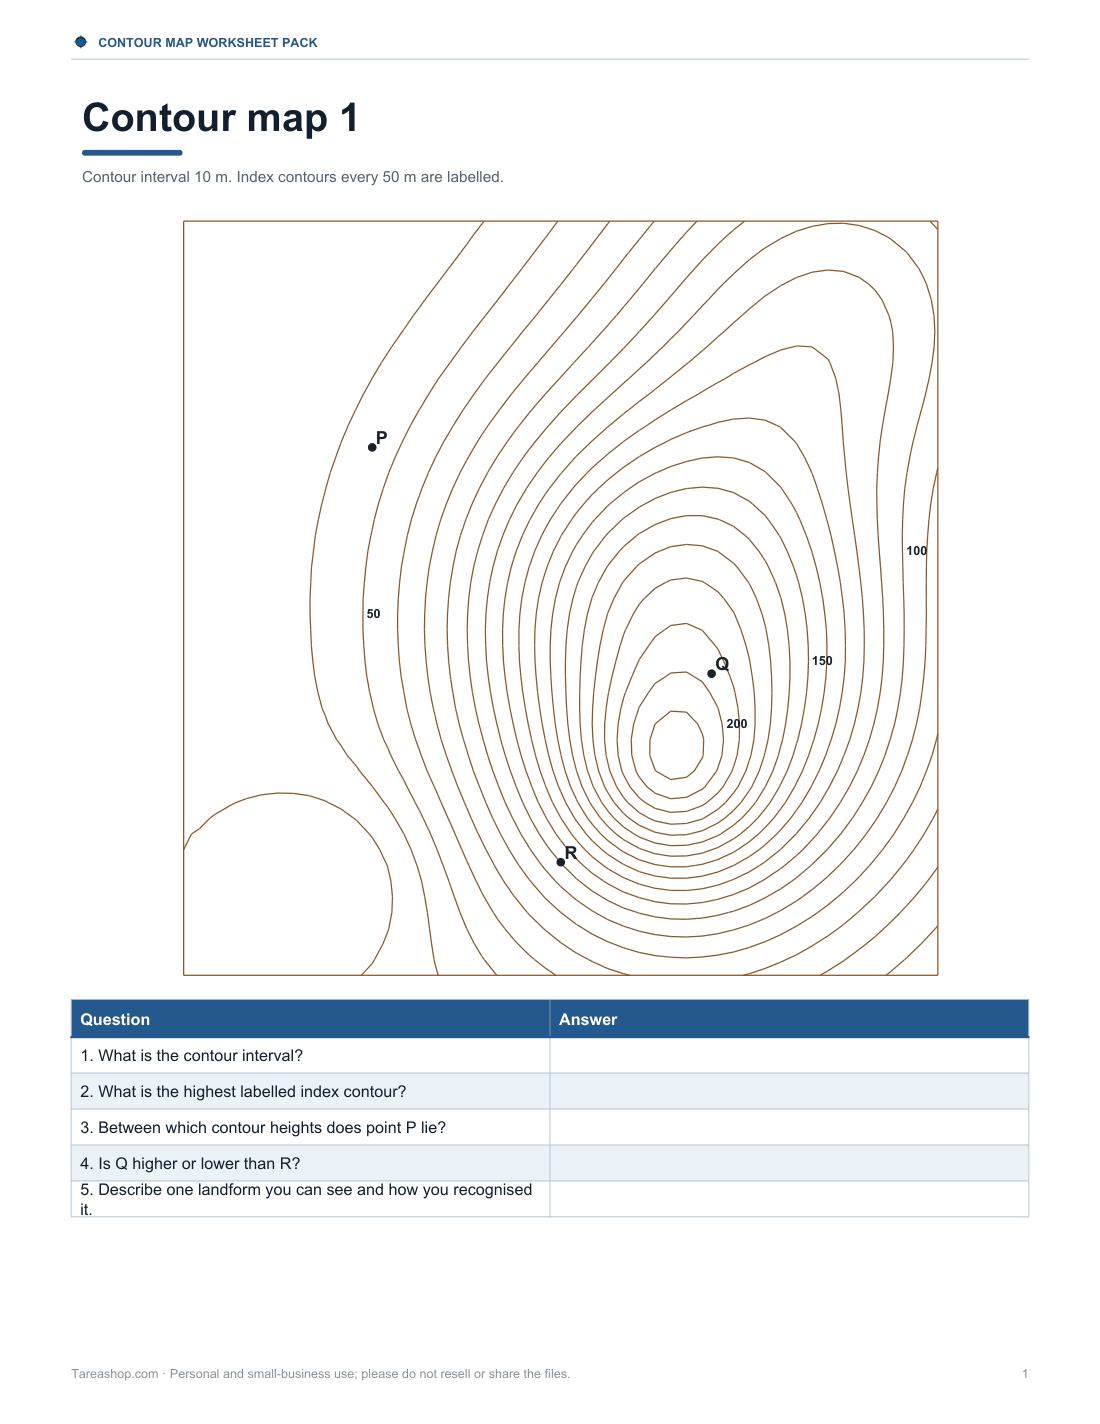
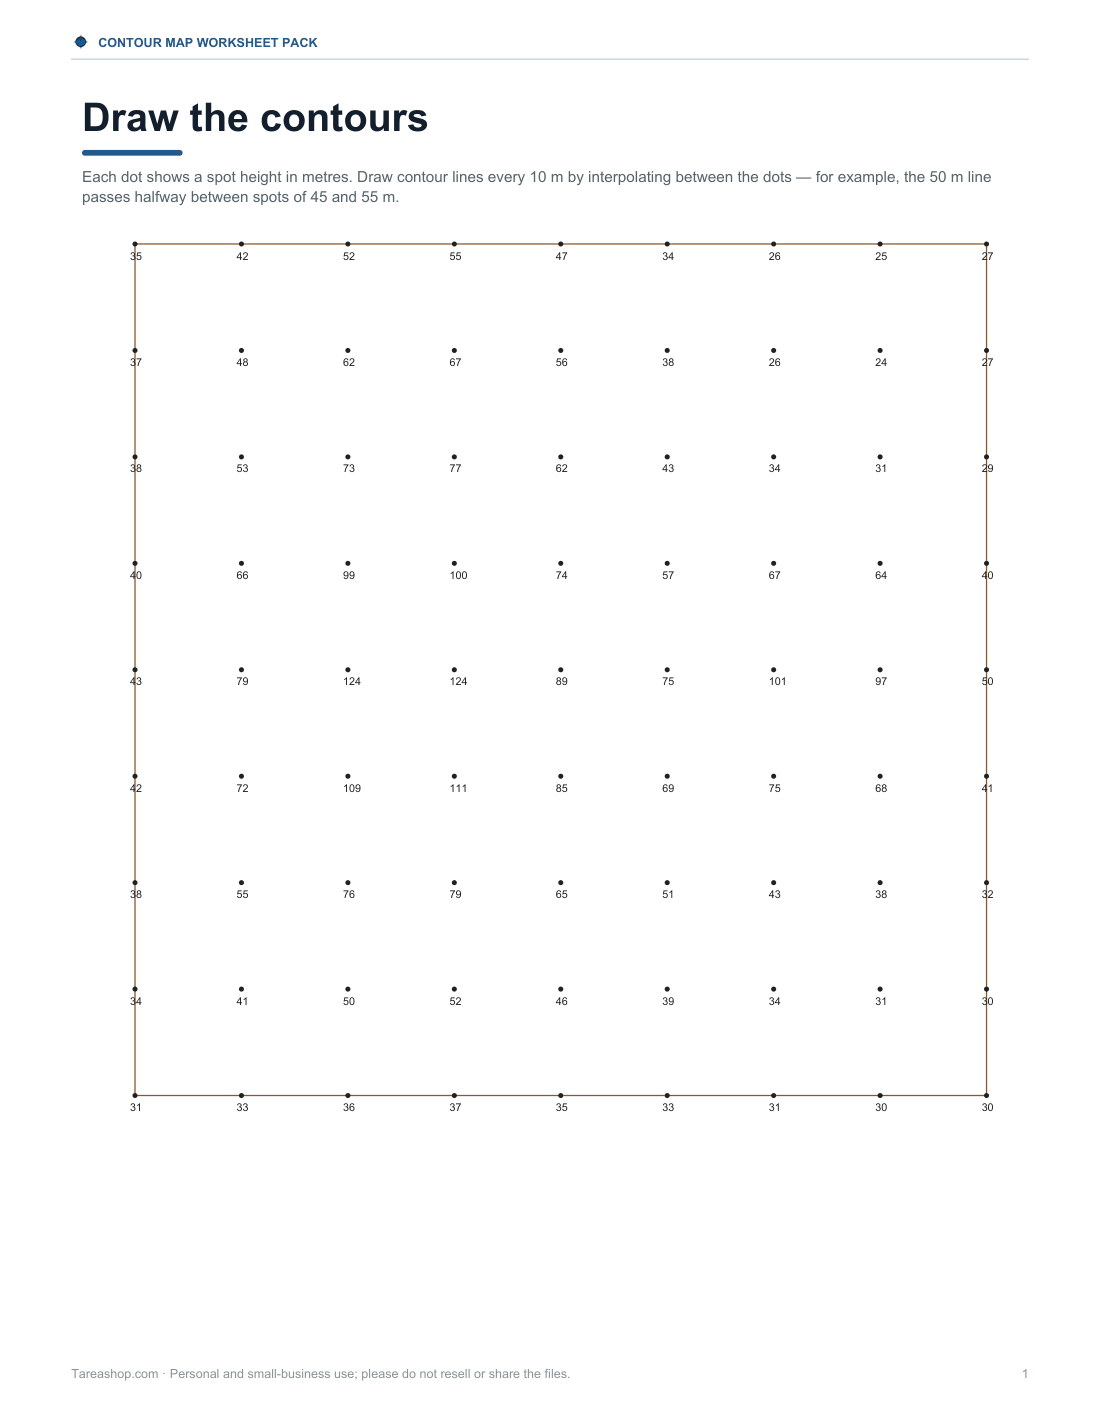
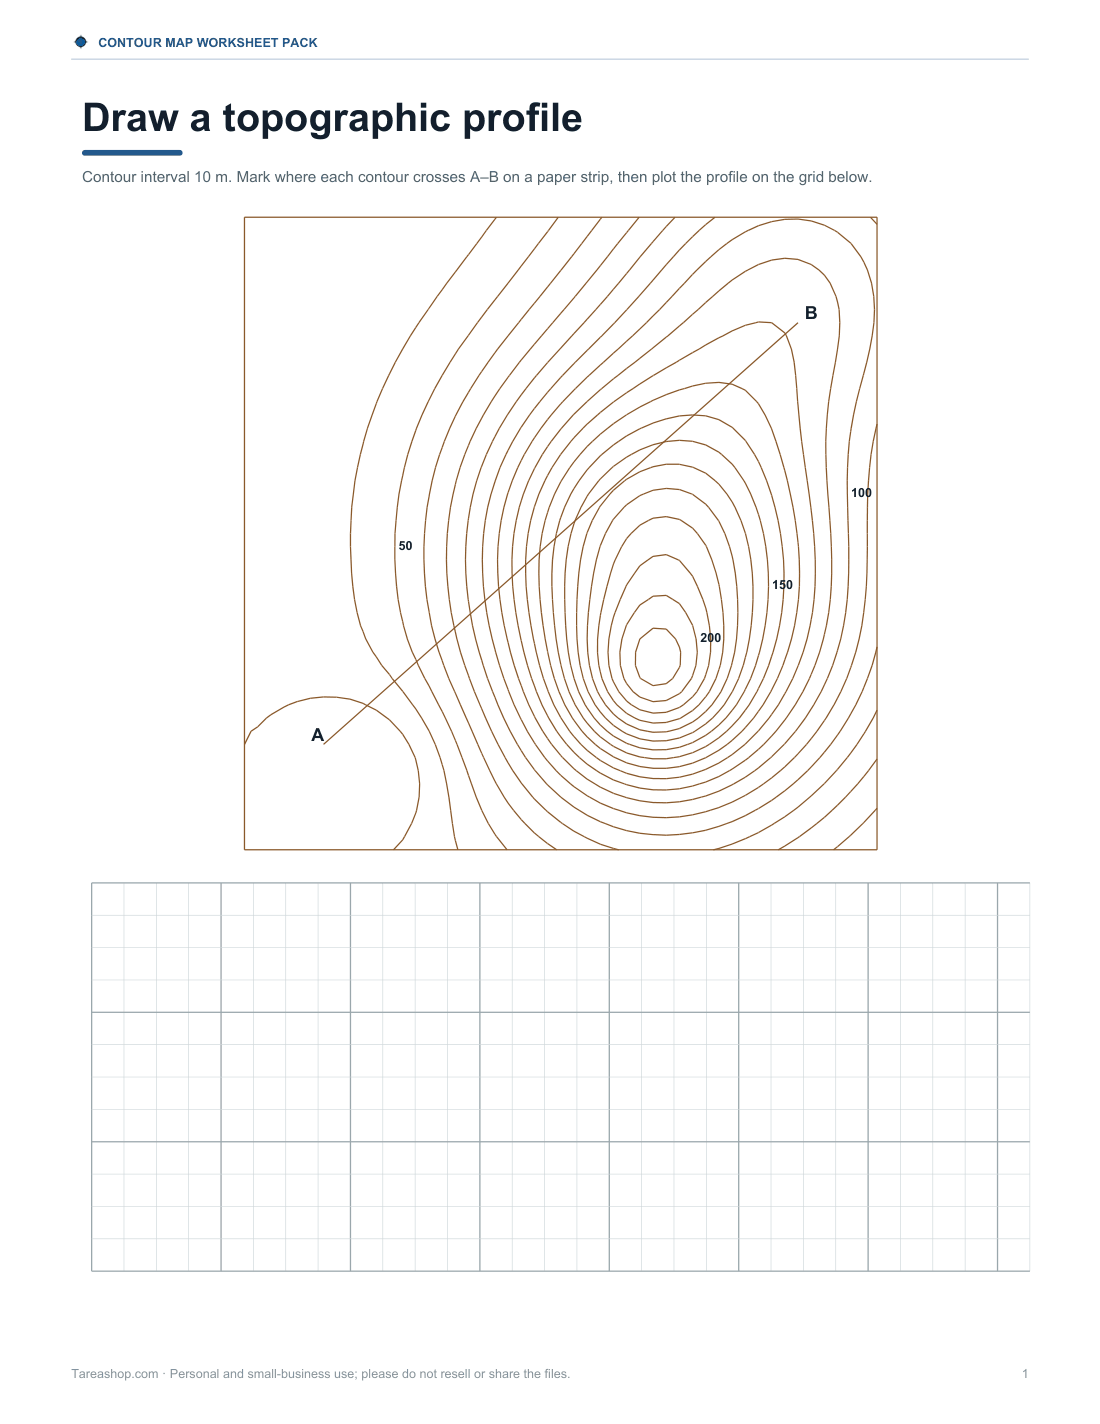
Contour map reading worksheets on three generated terrains with answer keys, a draw-the-contours exercise from spot heights, a topographic profile worksheet and a landform reference sheet.
- Map reading worksheets (PDF)
- Draw the contours (PDF)
- Profile worksheet (PDF)
- Landform reference (PDF/DOCX)
Formats: PDF, DOCX. Instant download after payment (link valid 72 hours, up to 5 downloads). AI-assisted: the templates were drafted with AI help and reviewed and laid out before publishing.
$5.00 USD, one-time 4 files · about $1.25 each
- Instant download
- 7-day refund
- Secure checkout by Stripe
7-day money-back guarantee. Full refund within 7 days of purchase, even after you download.
Free sample: Contour Map Reading Worksheets (PDF, 149 KB)
Full refund within 7 days — see the refund policy and license.
Free printables
Single sheets you can print right now, no sign-up. The full pack adds every sheet in one download plus the editable files.
 Contour Map Reading Worksheets
 Contour Map Drawing Worksheet
 Printable Contour Profile Worksheet
 Printable Landform Reference Chart
What contour lines show
A contour line joins points of equal height above a reference level, usually mean sea level. On a map, contours are drawn at a regular vertical spacing — the contour interval — and every fifth line is usually drawn thicker and labelled with its height (an index contour). Together they show the shape of the ground: where lines are close, the slope is steep; where they are far apart, the ground is gentle; where they form closed loops, there is a hill or a hollow.
Reading landforms
| Landform | What the contours look like |
|---|---|
| Hill or summit | Closed loops, highest value in the middle |
| Steep slope or cliff | Lines very close together, sometimes merging |
| Gentle slope | Lines widely spaced |
| Valley | Lines form V or U shapes that point uphill (upstream) |
| Ridge or spur | Lines form V or U shapes that point downhill |
| Saddle (col) | An hourglass-like low point between two closed summits |
| Depression | Closed loops with tick marks (hachures) pointing inwards and downhill |
| Plateau | Widely spaced lines on top, close lines around the edges |
A classic rule of thumb: where a contour crosses a stream it bends into a V that points upstream — “the V points to the source”.
Contour interval and map scale
Map makers choose the interval to suit the terrain and scale. Flatter regions use small intervals so gentle features still show; mountains use larger ones so lines don’t merge. National topographic maps commonly use intervals such as 5, 10 or 20 metres (or 10, 20 or 40 feet), and the interval is printed in the map’s margin — always check it. To find the interval yourself, take the difference between two labelled index contours and divide by the number of spaces between them.
Drawing a topographic profile
- Draw a line A–B across the map.
- Lay a strip of paper along the line and mark where each contour crosses, with its height.
- On graph paper, draw a horizontal axis the length of A–B and a vertical height scale.
- Transfer each mark up to its height and join the points with a smooth curve.
- Note the vertical exaggeration: the horizontal scale divided by the vertical scale.
The tool does this automatically when you click two points, sampling the terrain every few metres.
Vertical exaggeration
Profiles are almost always stretched vertically, or small hills would be invisible. If 1 cm on the profile represents 100 m horizontally and 10 m vertically, the vertical exaggeration is 100 ÷ 10 = 10 times. The tool reports the exaggeration of each profile; divide slopes seen on a profile by this factor to judge the real steepness.
Worked example
With the default terrain (seed 1164), a 2 km wide map and a 10 m interval, the highest point is about 216 m and the lowest about 20 m, so the map has roughly 19 contour levels, with an index contour every 50 m. The preset profile runs from A in the south-west to B in the north-east; the tool reports its length, start and end heights and average slope underneath the map. Switching to a 20 m interval halves the number of lines and makes the gentle areas look emptier — the reason flatter maps use smaller intervals.
Contour lines and real maps
The generated terrain behaves like real land in the ways that matter for learning: contours never cross (except at an overhanging cliff), every line eventually closes on itself or runs off the edge of the map, and a line can only be between two neighbouring values. Real topographic maps add more information — spot heights, trig points, streams in blue, vegetation, paths and rock symbols — and may use different colours for contours on rock or ice. Practising on a clean generated map first makes those busier sheets easier to read.
Using it in class or for games
- Generate a map for each student with a different seed, so answers can’t be copied.
- Ask students to find the highest point, the steepest slope and a valley, then draw a profile.
- Turn off colour-by-height to practise reading contours alone.
- Use “Add a hill” and “Dig a valley” to show how landforms change the lines.
- For tabletop or video games, download the SVG as a base for a fantasy map.
What’s in the template pack
- Contour map reading worksheets on three terrains, with answer keys
- Draw-the-contours exercise from spot heights, with an answer key
- Topographic profile worksheet with graph grid
- Landform identification reference sheet
Everything prints on US Letter or A4. The map maker itself is free and runs entirely in your browser.
Frequently asked questions
What is a contour map?
A map that shows the shape of the land with lines joining points of equal height.
What does it mean when contour lines are close together?
The slope is steep.
What is a contour interval?
The vertical distance between neighbouring contour lines.
What are index contours?
Thicker, labelled lines — usually every fifth contour.
How do I draw a topographic profile?
Mark where contours cross a line A–B and plot their heights on a graph; the tool does this for you.
Is this real terrain?
No — it is generated terrain for learning and design, not a real place.
Can contour lines cross?
No — except where a cliff overhangs, a point cannot have two heights.
How do I find the height of a point between two contours?
Estimate by its position between the lines: halfway between the 40 m and 50 m contours is about 45 m.
Why are some lines thicker?
They are index contours, drawn every fifth interval and labelled.